The Google Analytics API
There are several R packages for accessing the Google Analytics API, but the one we’re describing here is googleAnalyticsR, as it’s the one that one of the creators of this site created (and the co-creator of this site, as well as many, many users, have found to be fantastic)! However, if you want to check out some of others, see the list on the googleAnalyticsR home page.
The example below generates a web_data object that is used in various exercises throughout this site. So, you may want to build a script based on the instructions on this page and save it for future use as you work through other examples and exercises.
Installation
# This installs googleAnalyticsR if you haven't got it installed already
if(!require(googleAnalyticsR)) install.packages("googleAnalyticsR")
Authentication
By default you can authenticate using the googleAnalyticsR default project (we’re not going to dive into the details of what this means at the moment – it gets a little into the weeds of Google APIs and development):
library(googleAnalyticsR)
ga_auth()
Pause here, as, the first time you run the script, at least, it should open a web browser and require you allow access to your Google Analytics account. This is just providing the script that you’re running access to the data – nothing broader than that:
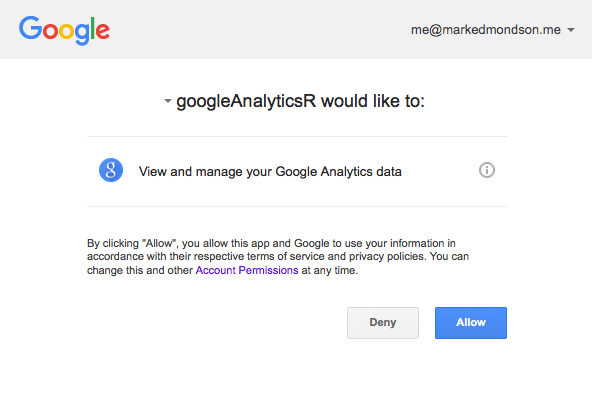
Sign in to give access for your session.
This will create a .httr-oauth file in your working directory folder that contains your authentication details. Keep this file safe as people could access your data if they have access to it.
Getting your View ID
To get your data, you need to specify which Google Analytics View you want to pull it from. There are a couple of ways to do this.
Option 1: Getting View IDs using R
The easiest way to find this is to use google_analytics_account_list() to list your Views, then read the number in the viewId column:
# Pull a full list of the views that you have access to
my_accounts <- ga_account_list()
Now, go to the Environment tab (top right pane in RStudio) and double-click my_accounts. Find the view you want to use and note the viewId value for it.
Option 2: Getting View IDs with Query Explorer
Another way to get the view ID is to go to the Google Analytics Query Explorer, log in (if you’re not already logged in), and select an account, property, and view. The view ID will be the value displayed in the ids field.
Querying your data
Once you have a view ID, you use it to download your data via the v4 reporting API with the google_analytics_4() function. See ?google_analytics_4 and the website for complete details and examples.
# Change this to your own view ID, as the one below will only work for accessing
# data from Mark Edmondson's blog, and it's highly unlikely you have access to that!
my_id <- 81416156

# Now, query for some basic data, assigning the data to a 'data frame' object
# called 'web_data'
web_data <- google_analytics_4(my_id,
                                date_range = c("2016-01-01", "2016-08-01"),
                                metrics = c("sessions","pageviews",
                                            "entrances","bounces"),
                                dimensions = c("date","deviceCategory",
                                               "channelGrouping"),
                                anti_sample = TRUE)
Now, display the first few rows of the resulting data frame (or, you can double-click on web_data in the Environment pane):
# Display the first few rows of the data that was returned.
head(web_data)| date | deviceCategory | channelGrouping | sessions | pageviews | entrances | bounces |
|---|---|---|---|---|---|---|
| 2016-01-01 | desktop | Direct | 8 | 9 | 8 | 7 |
| 2016-01-01 | desktop | Organic Search | 13 | 15 | 13 | 11 |
| 2016-01-01 | desktop | Referral | 3 | 5 | 3 | 1 |
| 2016-01-01 | desktop | Social | 2 | 2 | 2 | 2 |
| 2016-01-01 | mobile | Organic Search | 6 | 7 | 6 | 5 |
| 2016-01-01 | tablet | Organic Search | 3 | 3 | 3 | 3 |
Simple, right? This is a good opportunity to also check out the structure of a help file for a function. Type ?google_analytics_4 in the console and then read through the function documentation. You should notice that the example above only uses a handful of the options actually available in the function. But, you could stop here and play around with the actual query for a bit – changing out the dimensions and metrics and date range are a good start.